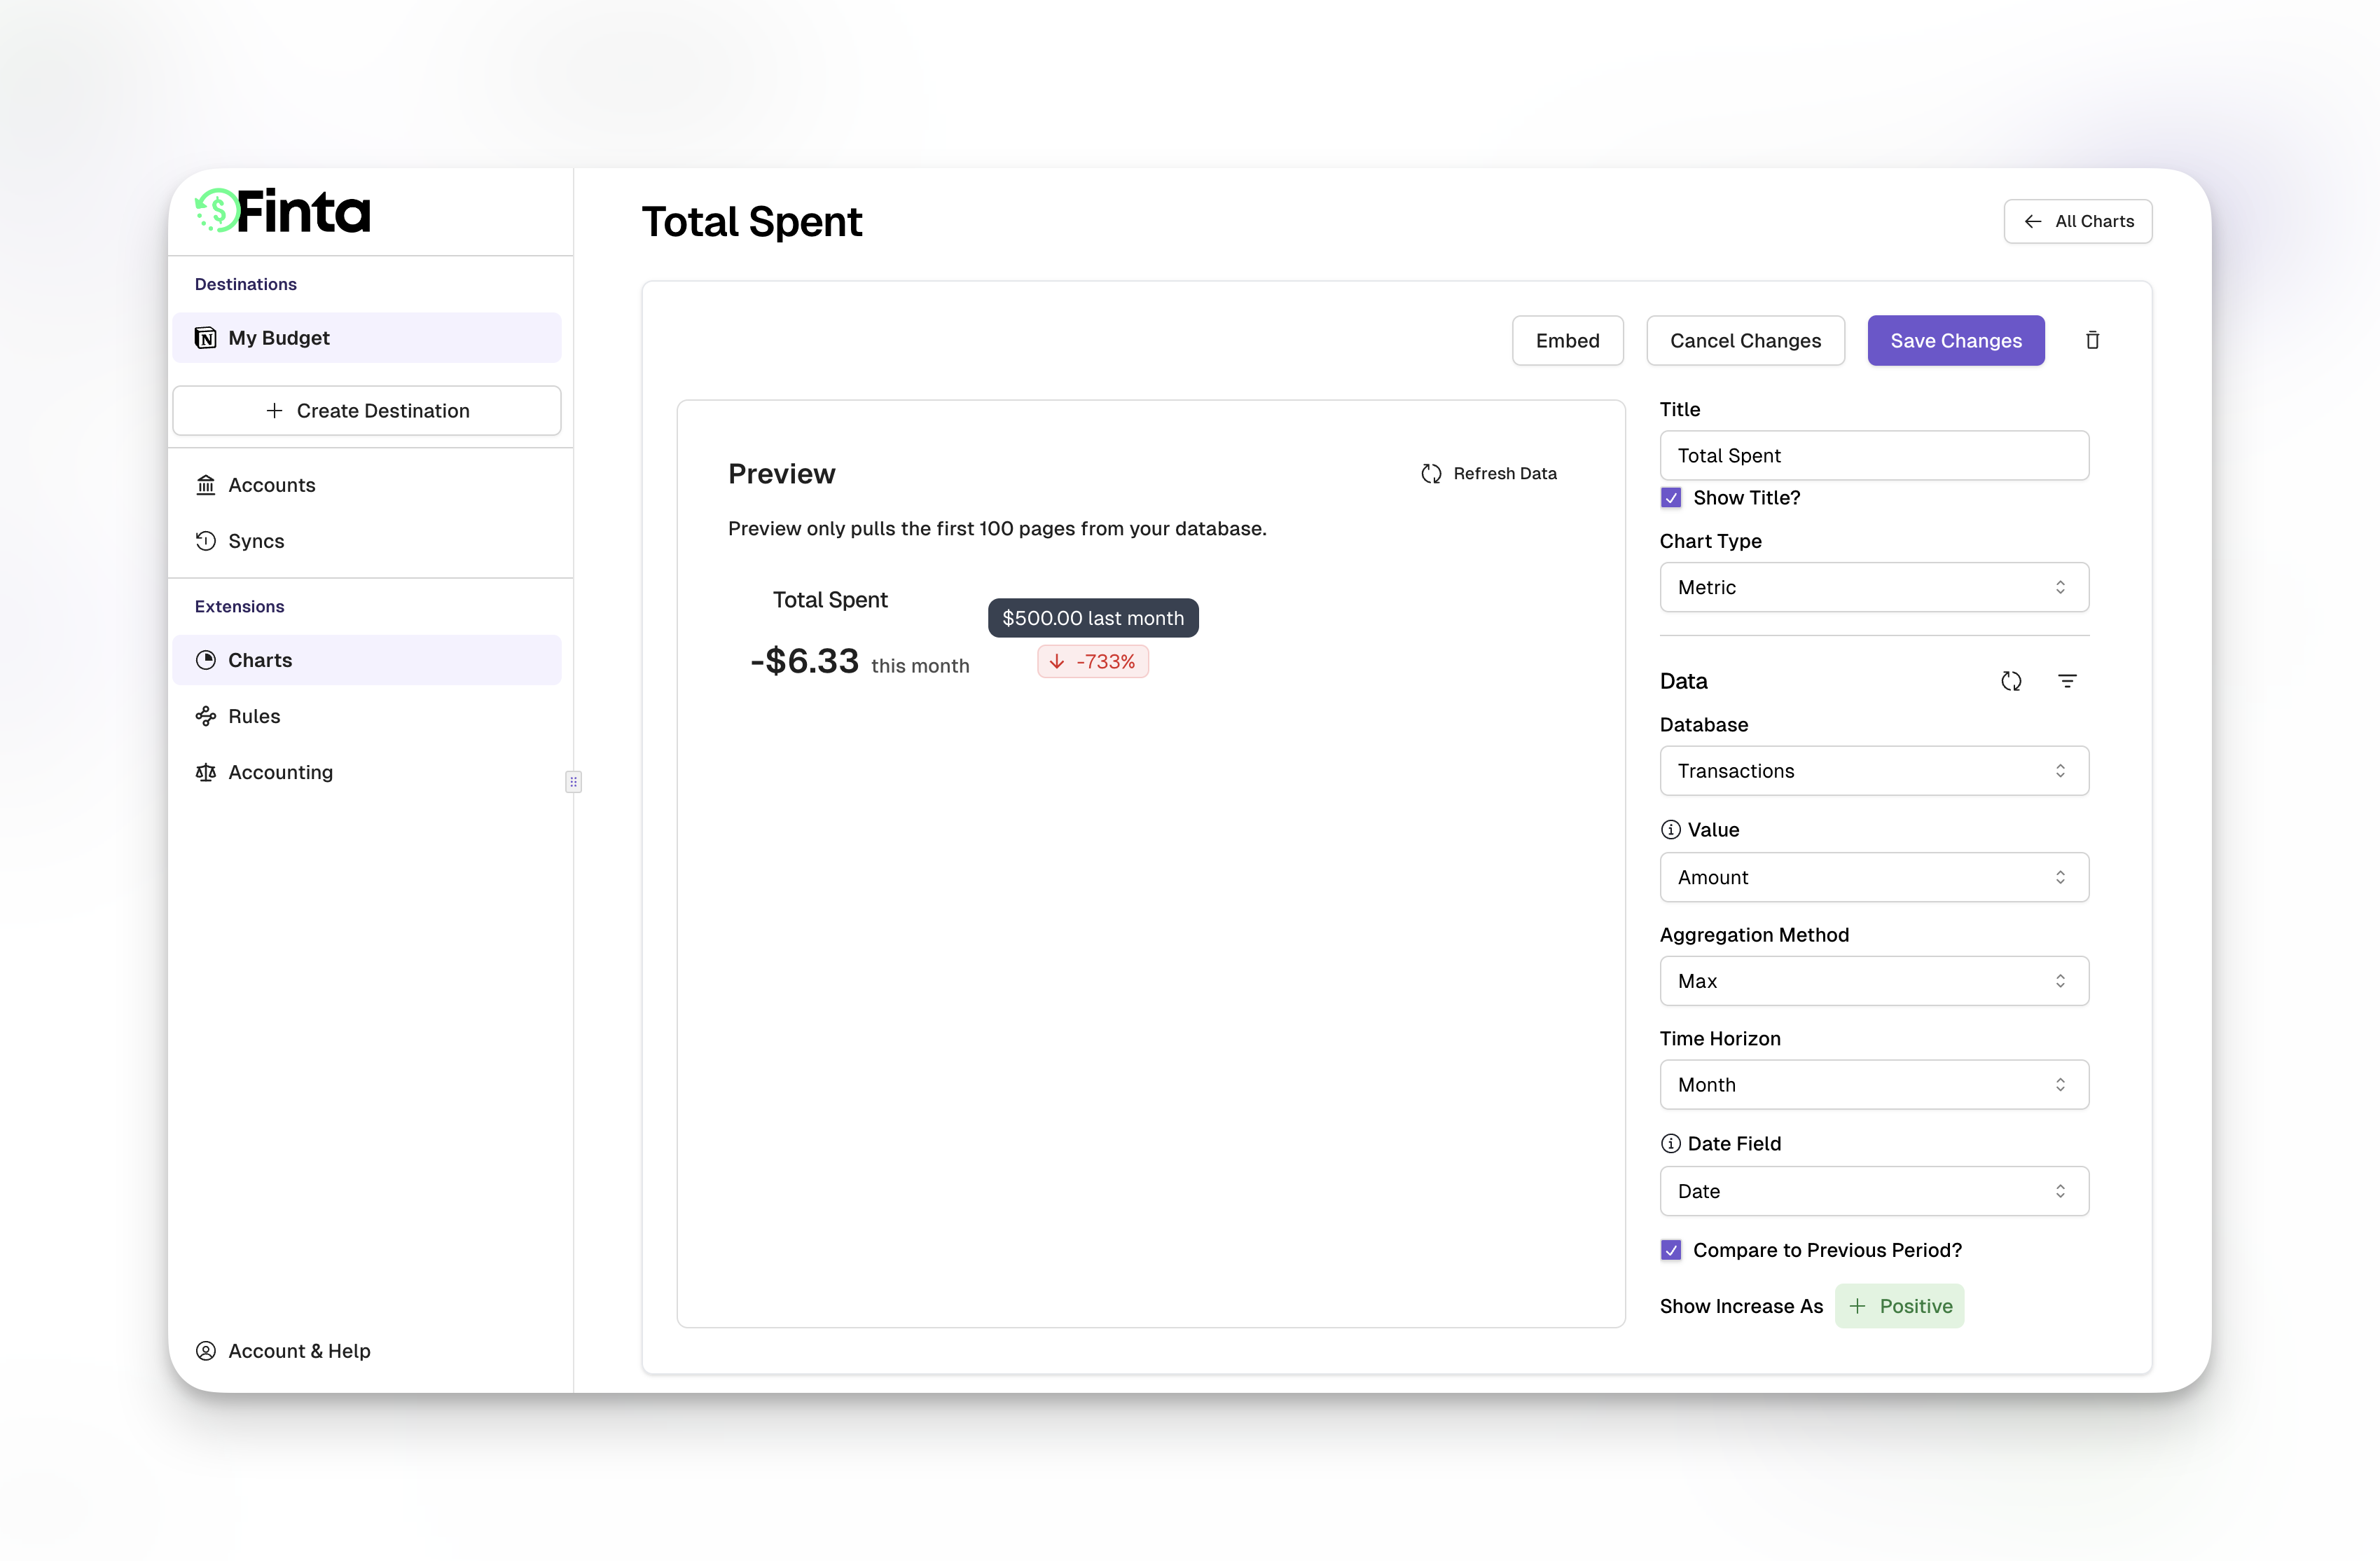

This week I'm working on enhancing my charts extension. First stop: Metrics Chart.
Now you can view a metric for a given time period and compare that metric to the previous time period. Also, I've added the ability to aggregate by sum, max, min, or average.
This can be helpful if you want to add a chart to Notion for:
- Max expense this quarter
- Total spent this week
- Average expense this month